
LND Live Debugging
In this guide we’ll cover setting up your dev environment to allow you to:
step through unit / integration tests
debug an LND instance connected to a cluster
Stepping through unit tests
Stepping through LND unit tests is easy to set up. If you are hoping to get up to speed with the LND codebase this is an excellent way to get started.
Start by installing go on your system, then clone lnd:
$ git clone https://github.com/lightningnetwork/lnd.git
Open Visual Studio code
Open the checked out LND repo
Install any missing extensions
Open for example buffer/buffer_test.go
Set a breakpoint in the body of e.g func TestRecycleSlice(t *testing.T) {
Click on run > Start Debugging
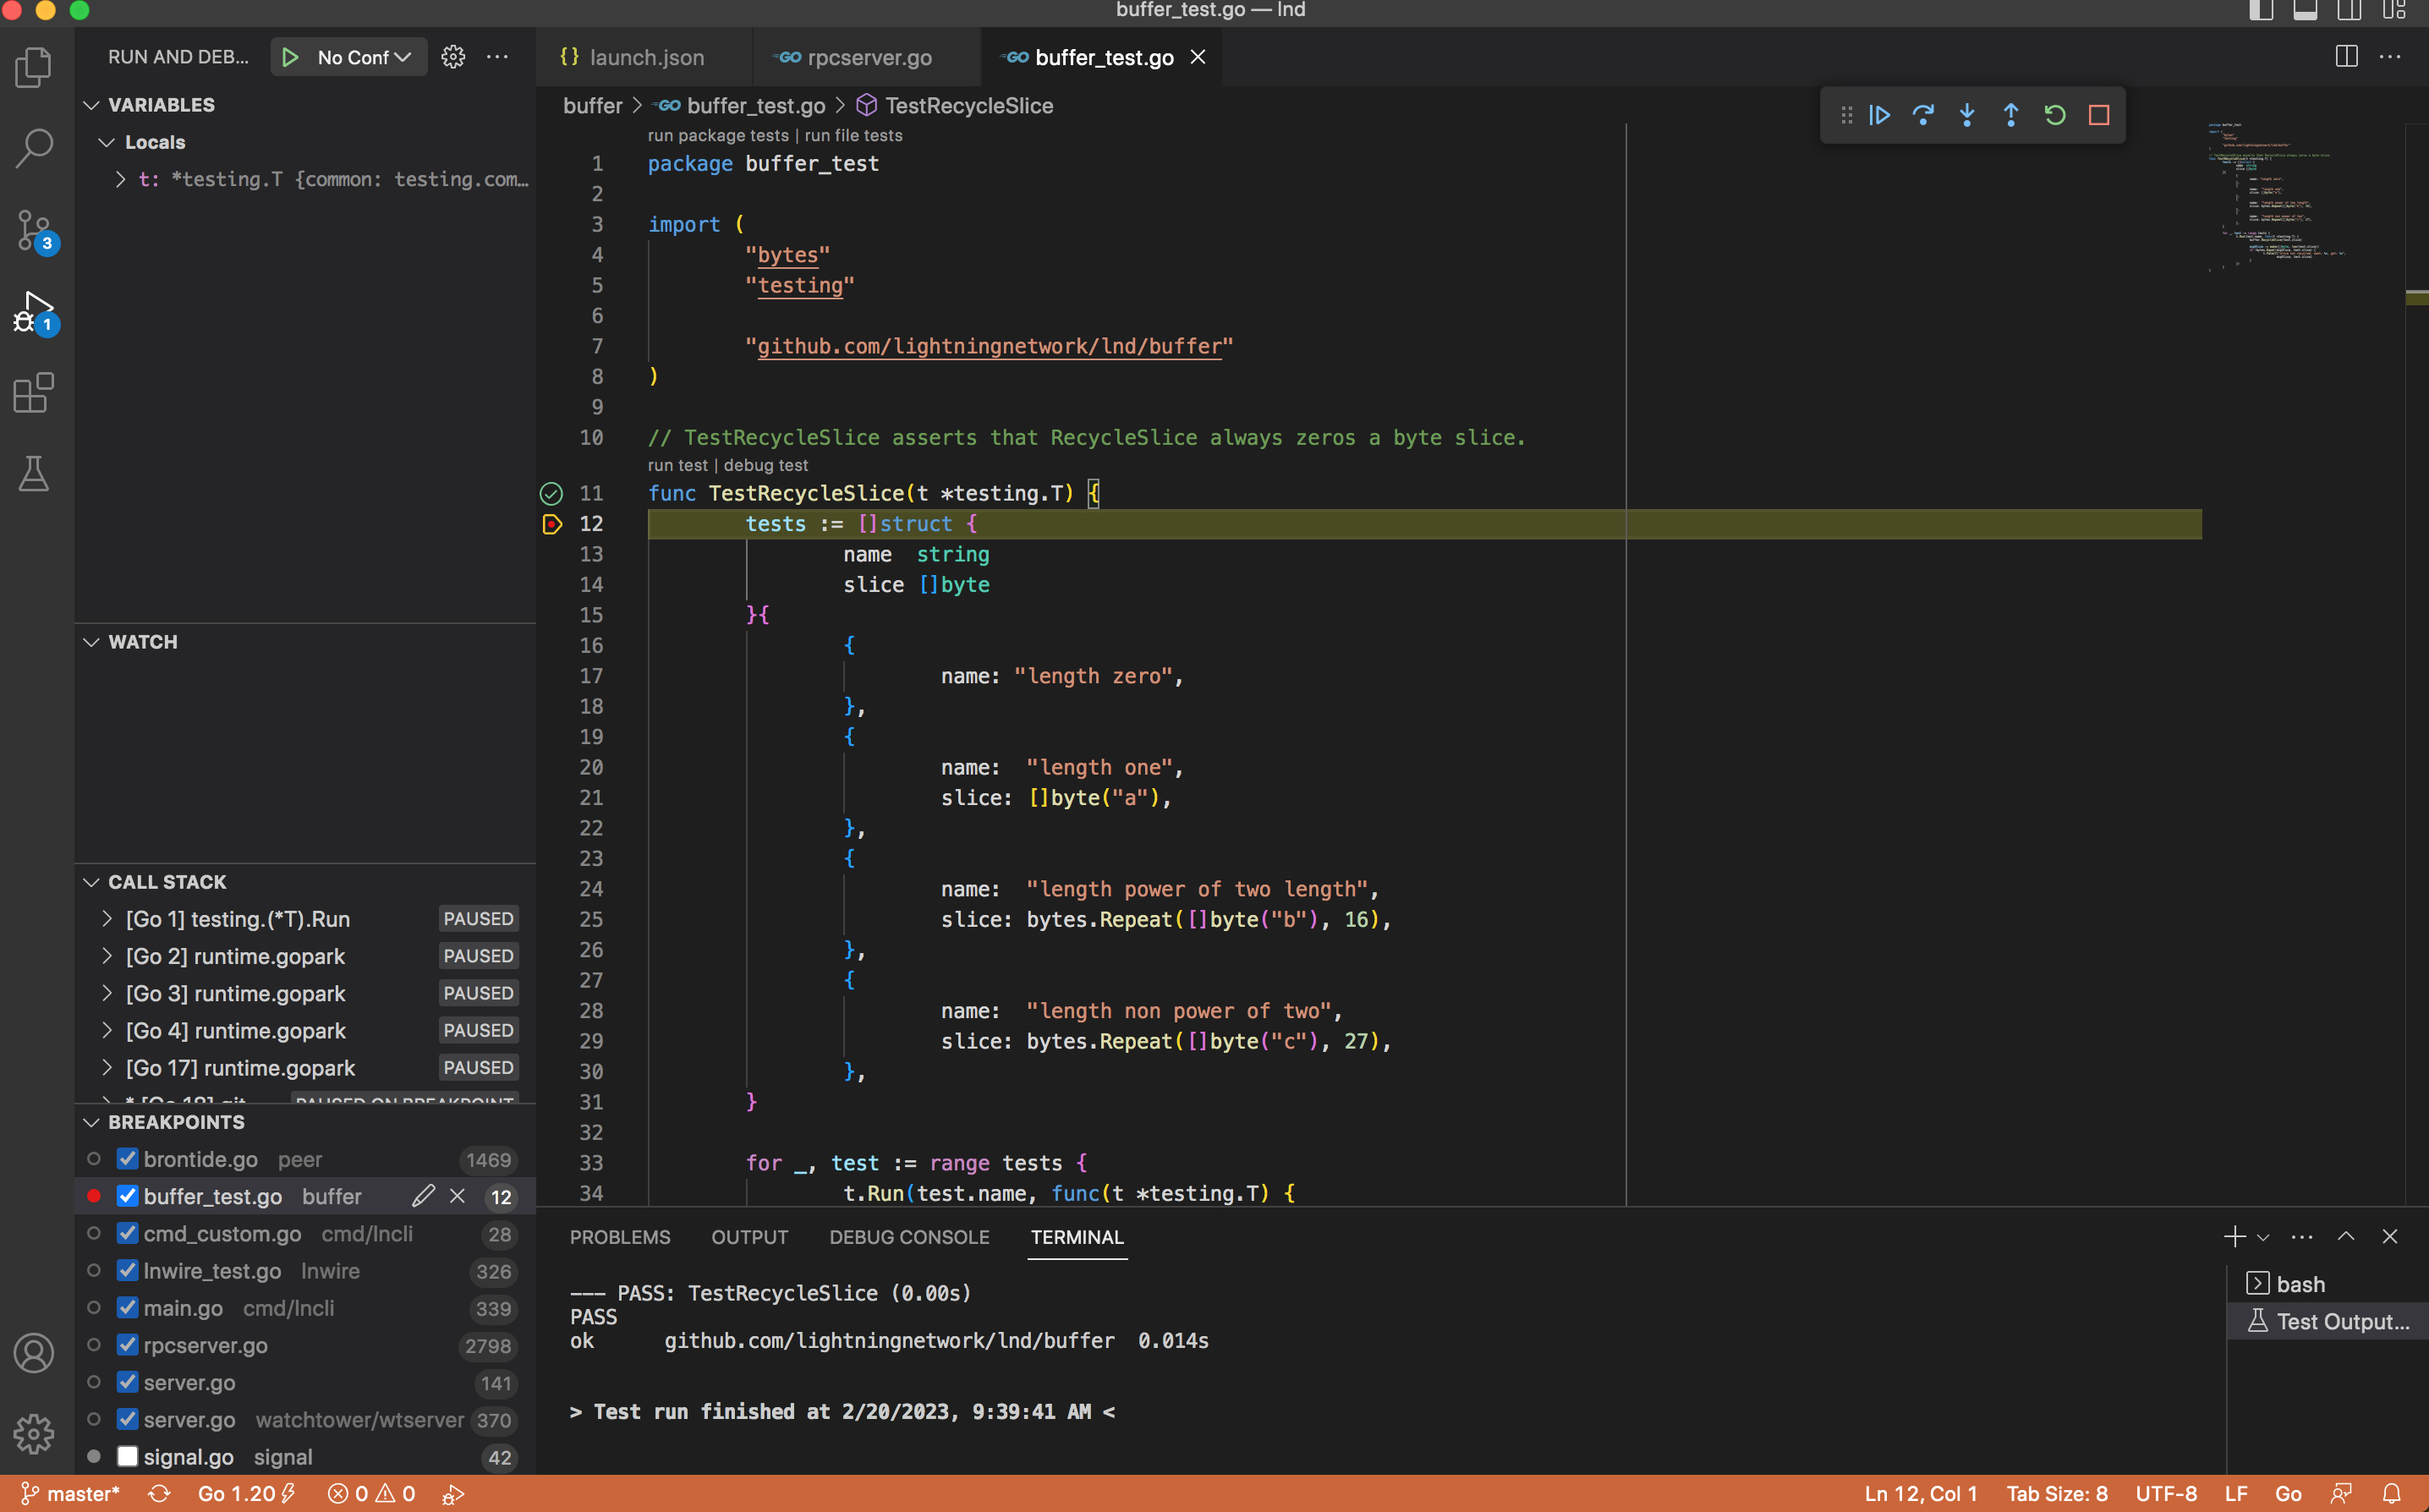
Visual studio should build and run the test file in question. If you are new to the LND codebase, then stepping through tests is an excellent way to get started as they really focus on a very narrow––and therefor manageable––section of the codebase.
Setting up a local LND cluster
Setting up a local LND cluster is a little bit more complex, but not that much more complex.
                              (1)                        (1)
                           + ----- +                   + --- +
VSCode <-----> dlv <-----> | Alice | <--- channel ---> | Bob |
                           + ----- +                   + --- +
                               |                          |
                               |                          |
                               + - - - -  - - - - - - - - +
                                                          |
                                                 + --------------- +
                                                 | BTC/LTC network | <--- (2)
                                                 + --------------- +
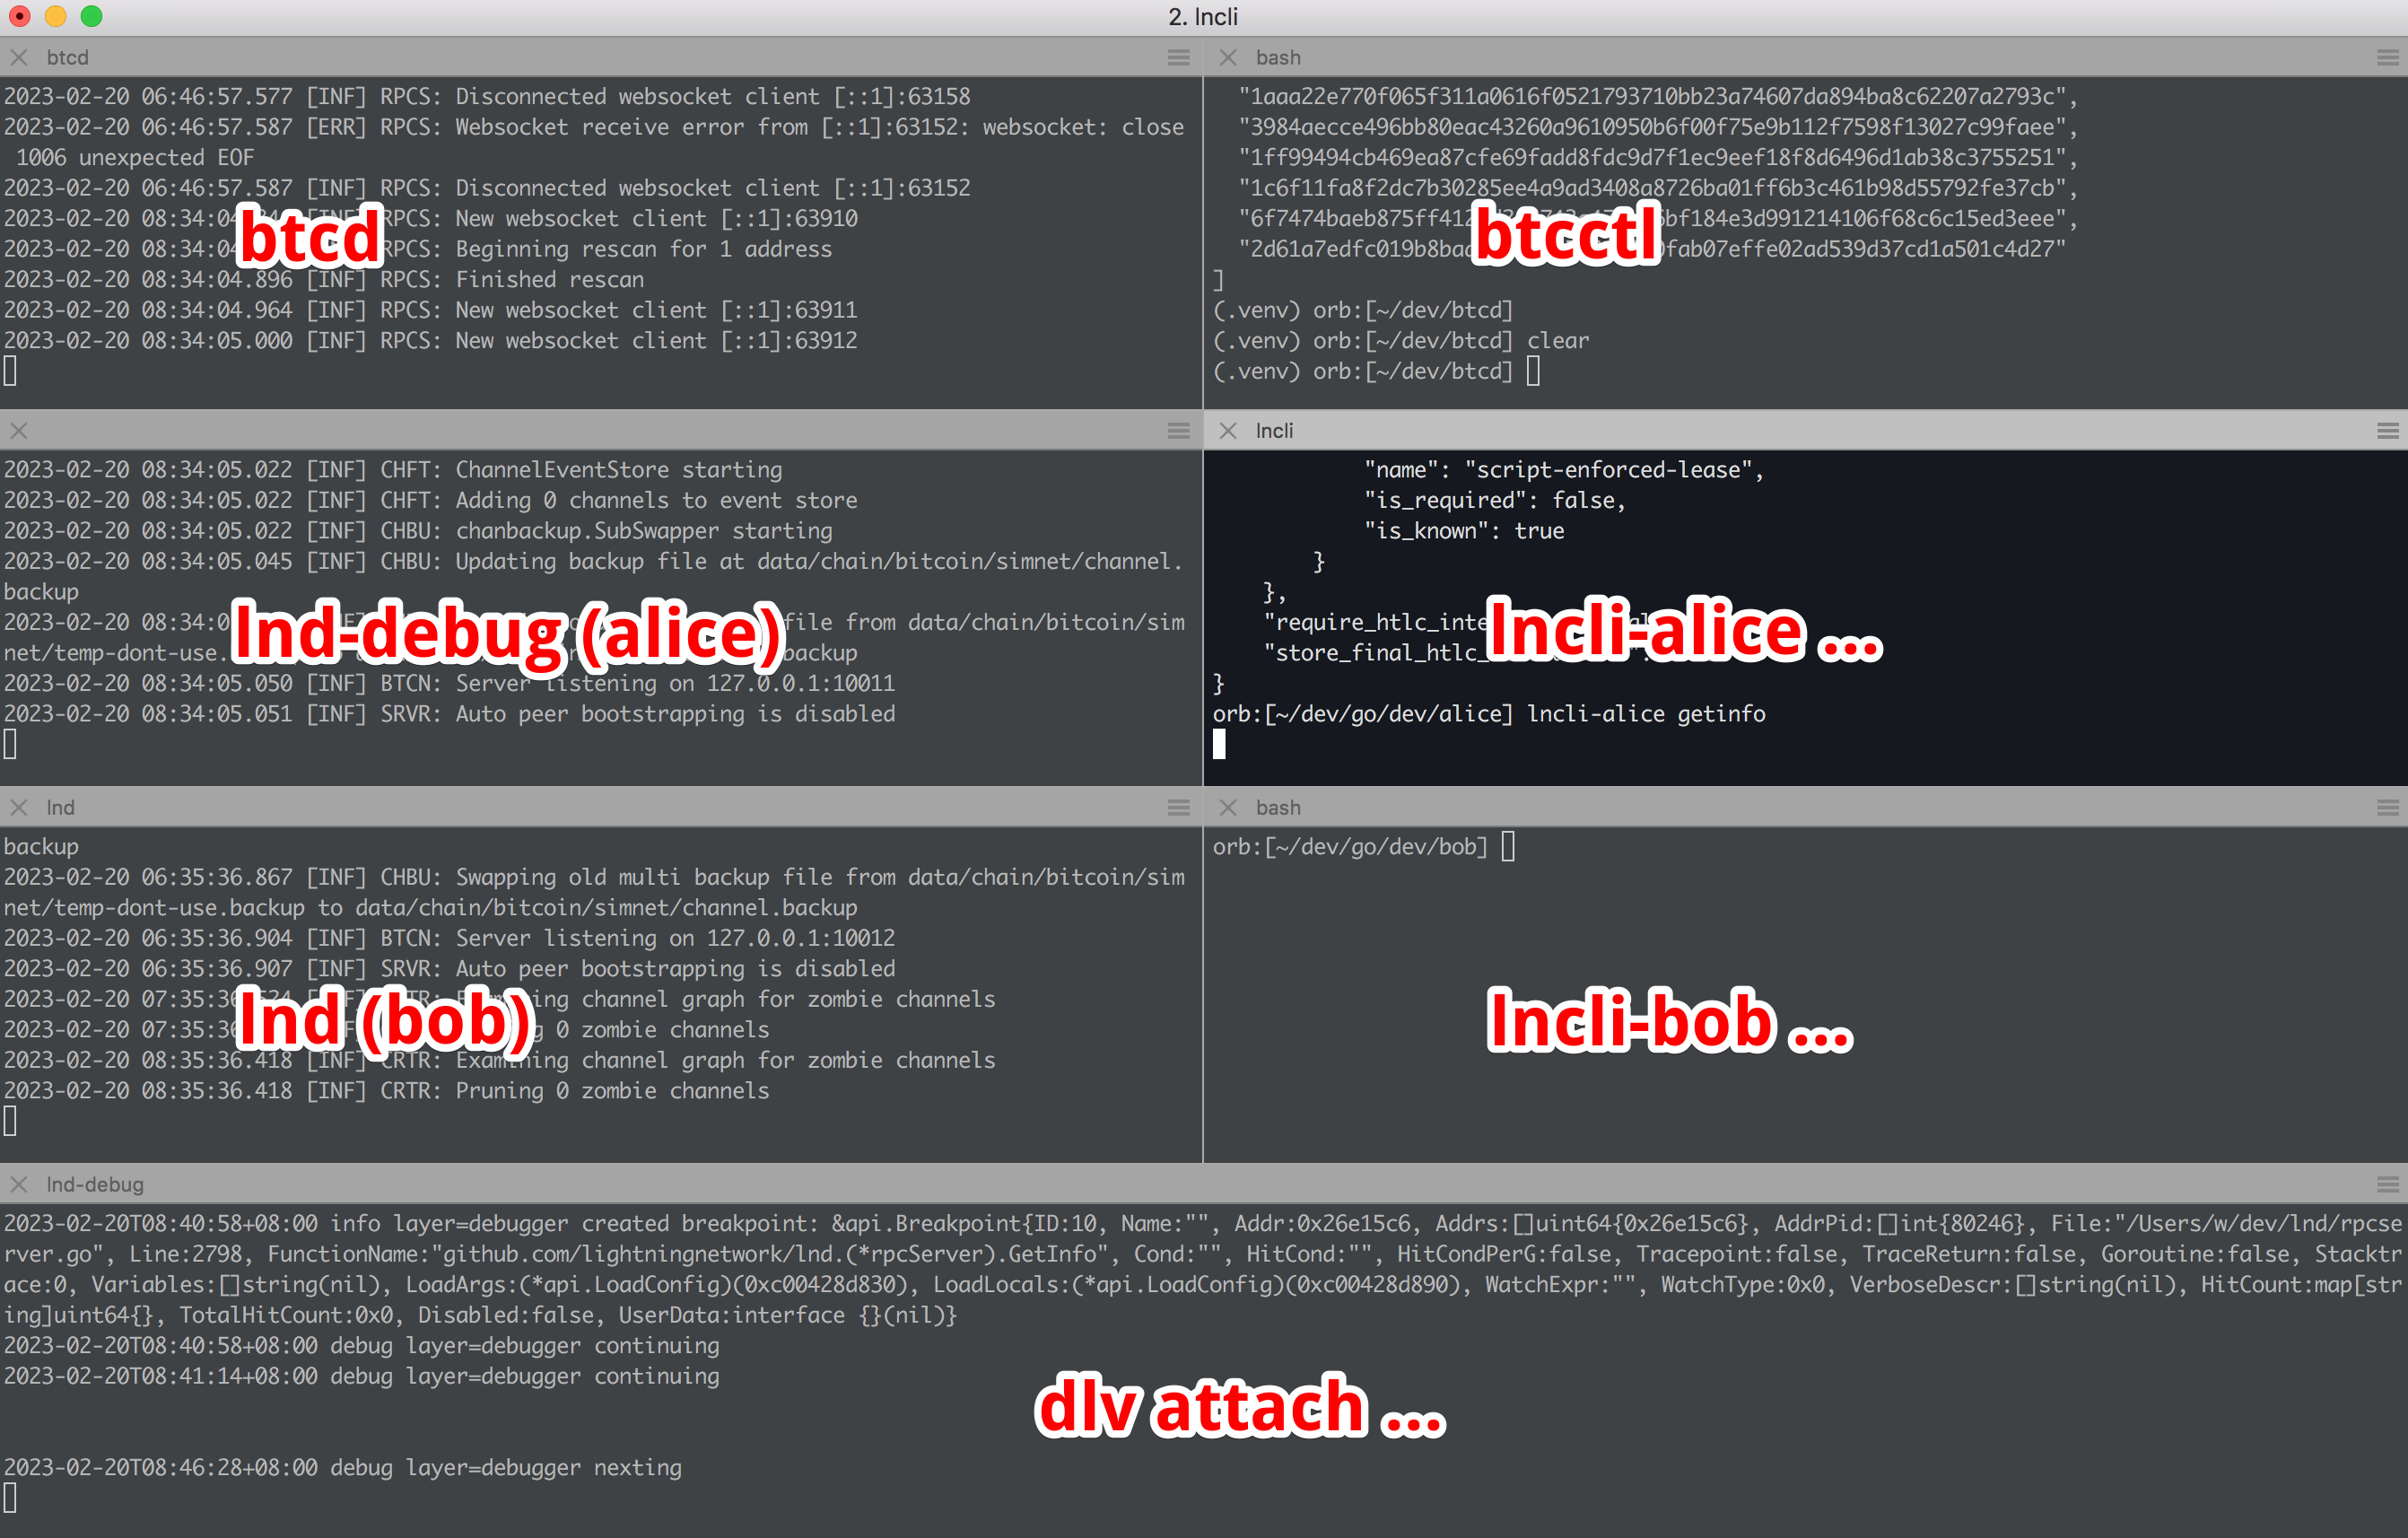
Before we continue, please note that in this guide you’ll see split terminals. Terminal splitting can be achieved with terminal software such as iTerm2, tmux, GNU Screen, Terminator, Alacritty etc. Terminal splitting makes working with multiple terminals a lot easier, and will help you keep your work organized.
So the next step is to go through setting up a local LND cluster tutorial until you have:
A funded Alice lnd instance running.
A funded Bob lnd instance running.
(there is no need for a third instance for this guide, so Alice and Bob will do).
Once again, going through the setting up a local LND cluster without terminal splitting can be a bit overwhelming. However with terminal splitting (as you’ll see in the rest of this guide), and carefully going through Lightning Labs’s tutorial step by step is very manageable.
Running the debug build
In the LND cluster tutorial, the command being run is lnd however we’ll want to run lnd-debug from a local lnd repo. If you haven’t checked out the lnd repo already, do so now:
$ git clone https://github.com/lightningnetwork/lnd.git
$ cd lnd
$ make build
You’ll also want to add this line to your ~/.bashrc file:
PATH=/path/to/lnd/repo/:${PATH}
Installing Delve
The next step is to install the dlv debugger:
$ go install github.com/go-delve/delve/cmd/dlv@latest
$ hash -r
$ dlv version
Attaching dlv to LND
Kill your alice lnd instance.
In the same directory (alice) source .bashrc with:
$ source ~/.bashrc
restart it with:
$ lnd-debug --rpclisten=localhost:10001 --listen=localhost:10011 --restlisten=localhost:8001
next, in a spare terminal, run the following:
$ dlv attach $(pgrep lnd-debug) --headless --listen=:2345 --api-version=2 --log=true
This starts dlv in headless mode, listening on port 2345.
Next, in Visual Studio Code:
On the left-hand side of the Visual Studio Code, click on the Debug icon.
Click on the “create a launch.json file” link at the top of the Debug view.
Your launch.json should look like this:
{
    "version": "0.2.0",
    "configurations": [
        {
            "name": "LND dlv",
            "type": "go",
            "request": "attach",
            "mode": "remote",
            "remotePath": "${workspaceFolder}",
            "port": 2345,
            "host": "localhost",
            "showLog": true,
            "apiVersion": 2,
            "trace": "verbose",
            "cwd": "${workspaceFolder}"
        }
    ]
}
Open a file, for example rpcserver.go
Set a breakpoint, e.g in the GetInfo function
Click on the green “Start Debugging” button
Visual Studio’s bottom bar should turn Orange, signaling it has successfully connected to the debugger
Now from the alice terminal, run:
$ lncli-alice getinfo
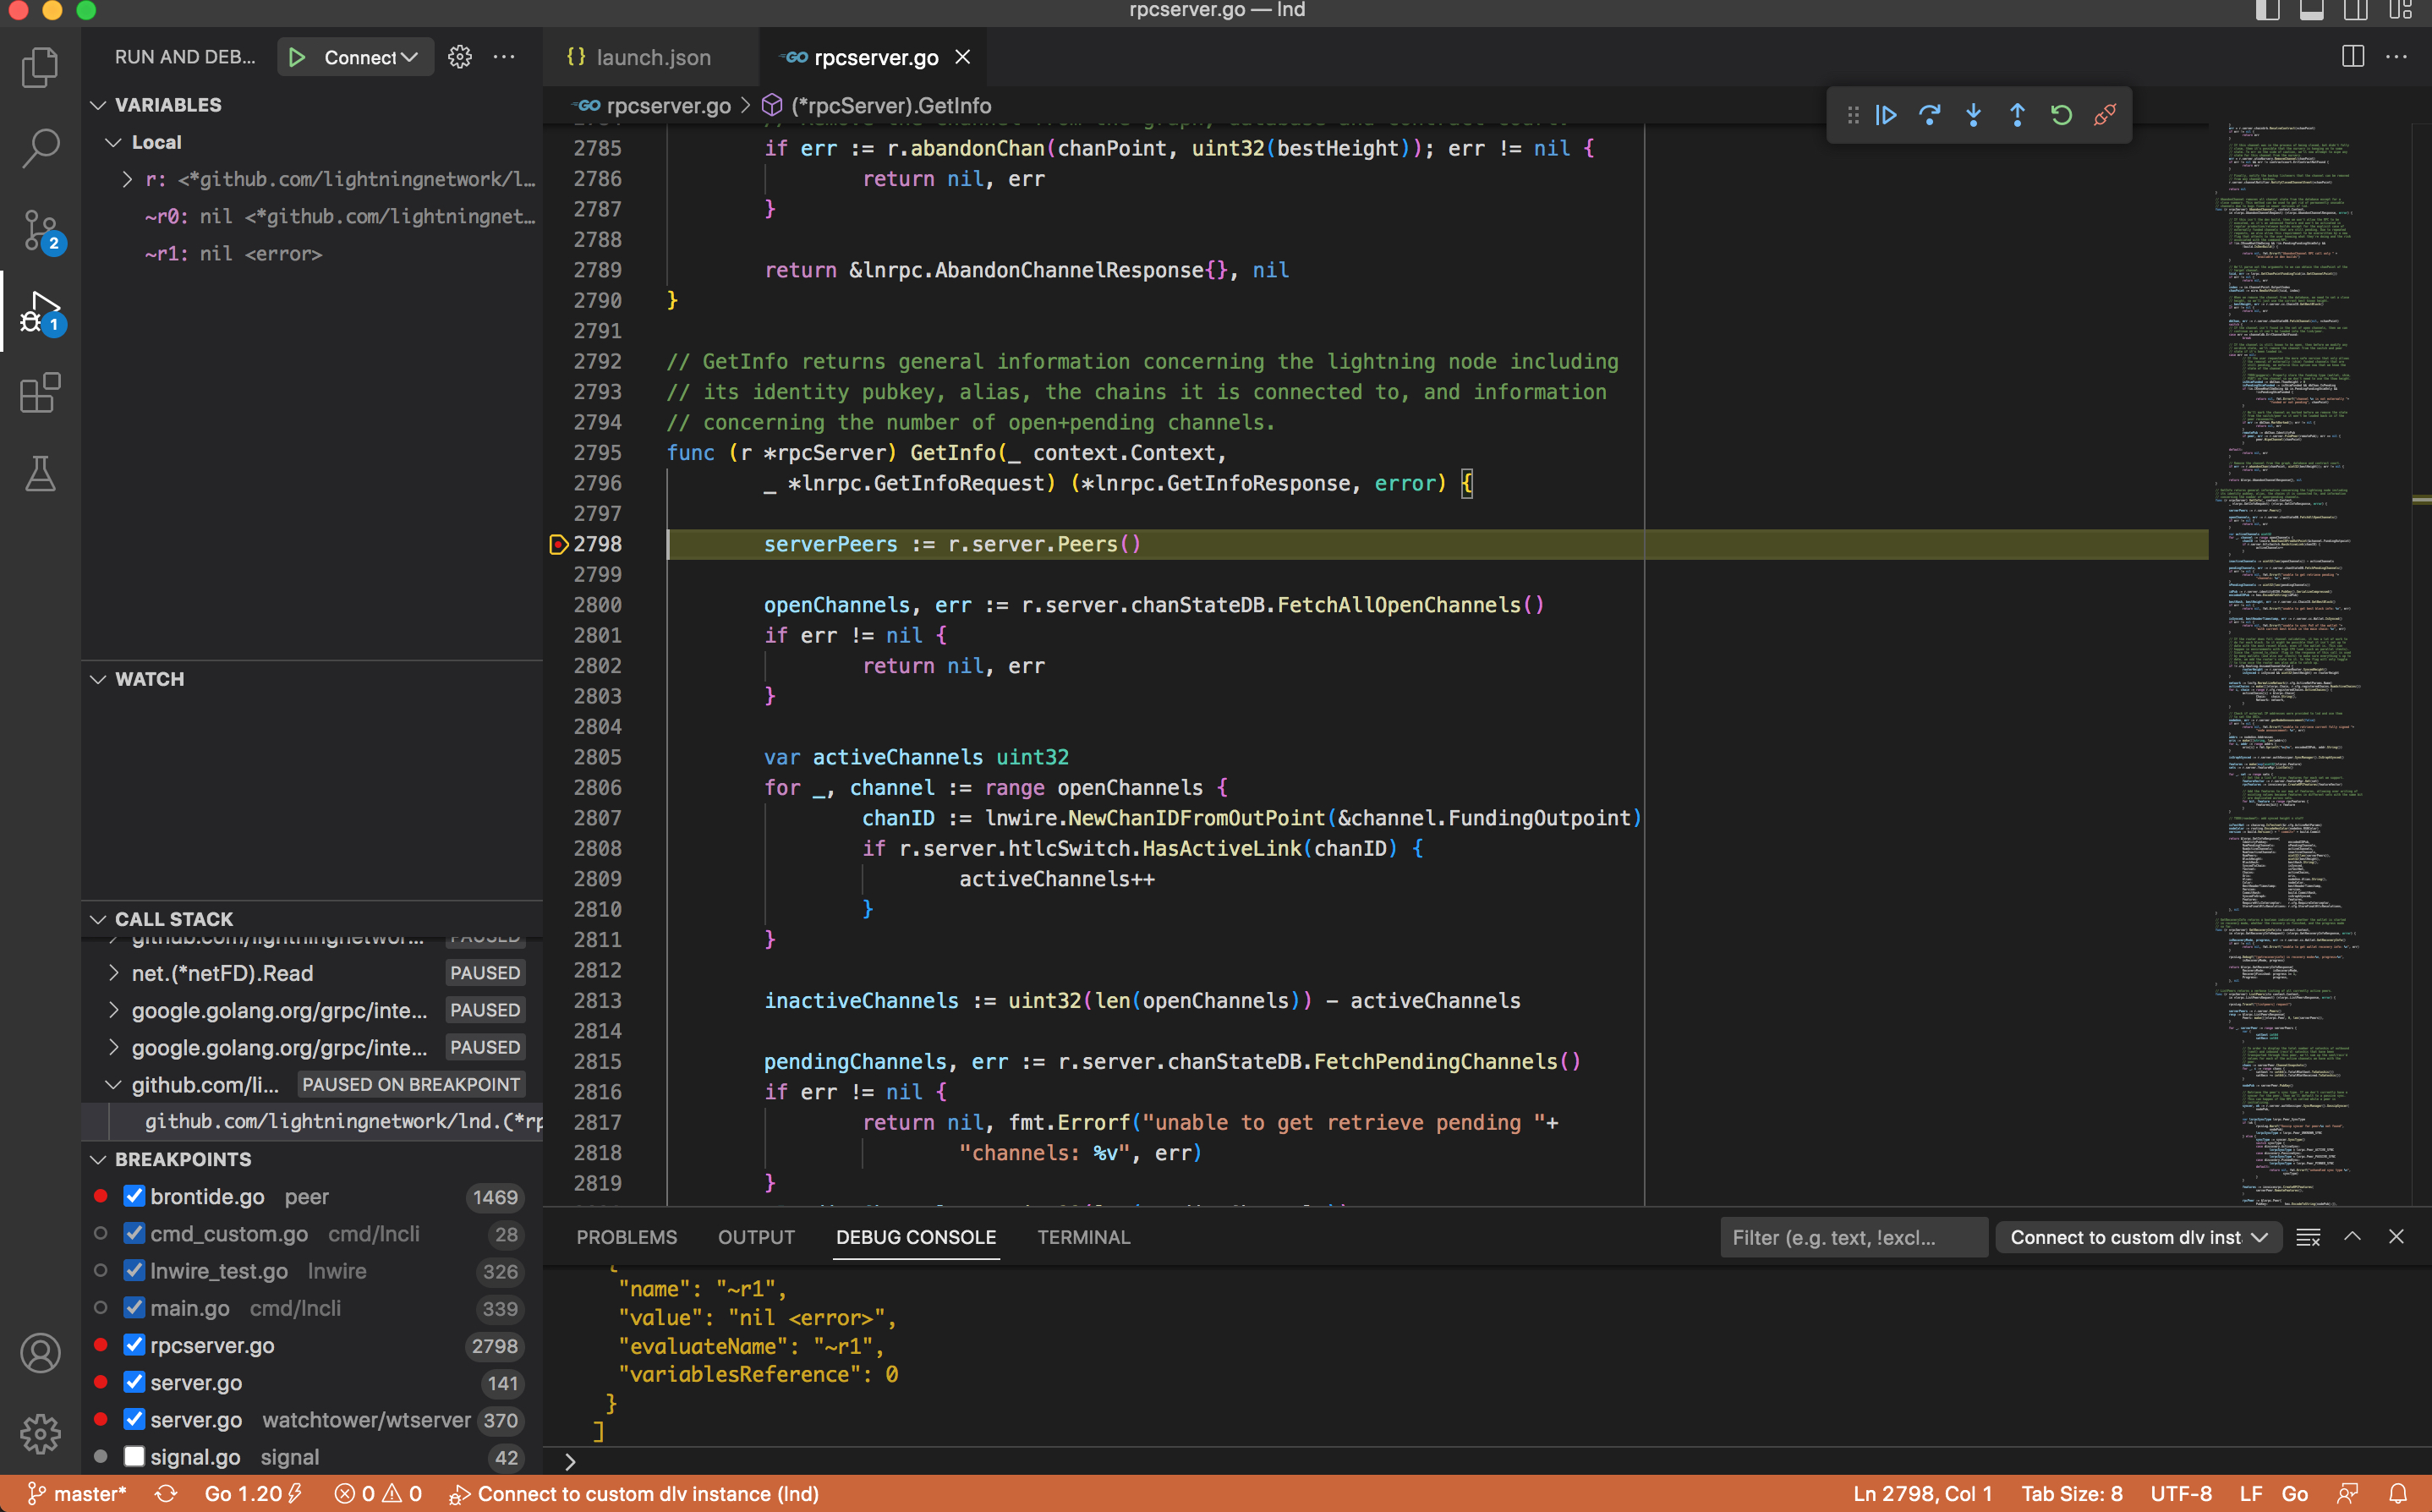
Visual Studio should break execution, the breakpoint line turning yellow. You can now step the code, step into functions, see the contents of variables etc.
Note
You may be tempted to run dlv in one line, e.g dlv <dlv-flags> – lnd-debug <lnd-flags> however this appears to require the debugger to be started before you can run lnd-unlock. There are also ways of configuring launch.json directly with dlv etc. however this also seems to have issues.
The setup in this guide has been tested; it provides the most control over the processes and appears to be the only one to work reliably.
What about bob?
We went through all that effort of setting up bob, but never made use of him.
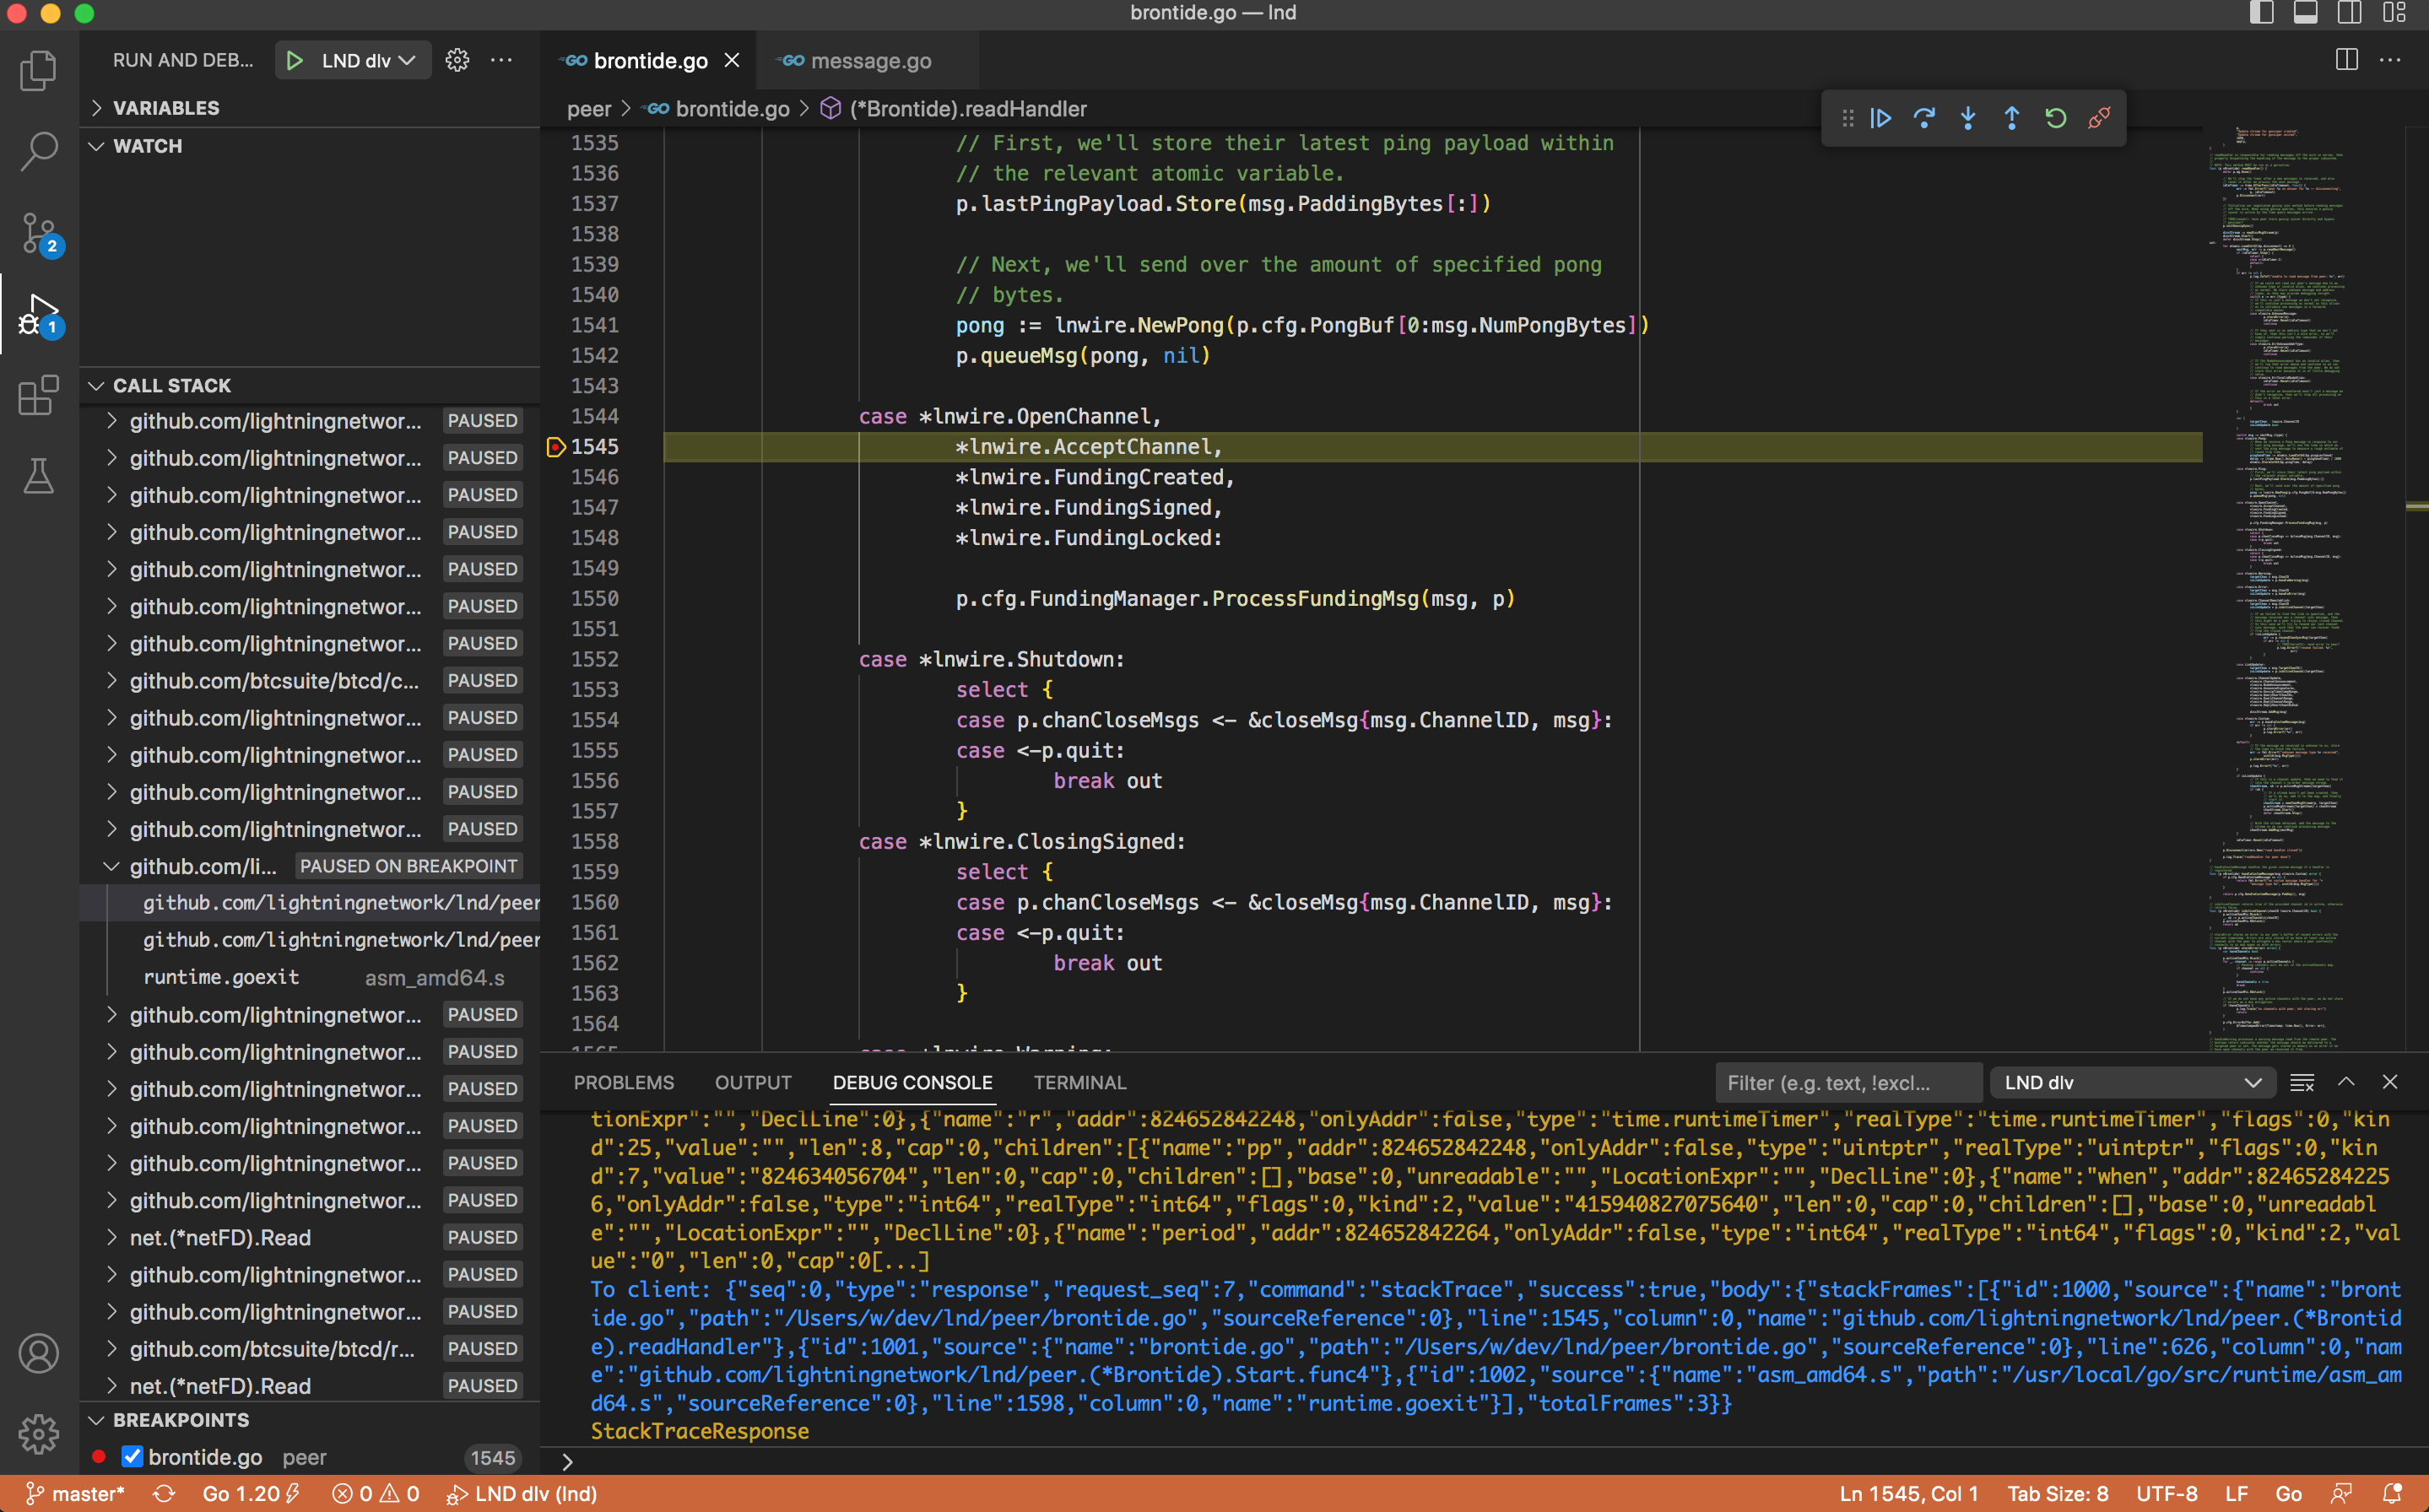
Open peer/brontide.go. Brontide handles high level messaging between peers.
Search for case *lnwire.Pong and set a (in the readHandler), and set a breakpoint in the body of that case.
Get the pubkey for Alice:
$ lncli-alice getinfo
Connect bob to alice
$ lncli-bob connect <alice_pubkey>@localhost:10011
After some time, the breakpoint in the readHandler pong case should get triggered. Nothing over the top, but we are recieving signals from Bob. If the pong breakpoint never breaks, you may need to restart the dlv process, or lnd-debug then dlv processes, then restart debugging.
Sometimes debugging can be finicky but it works.
Intercepting a channel open message
Remove the previous breakpoint in the pong case.
Create a new breakpoint in the case *lnwire.OpenChannel.
Now open a channel from Bob to Alice:
$ lncli-bob openchannel --local_amt 100_000 <alice_pubkey>
Visual Studio Code should intercept the channel open request
Remember you’ll need mine some blocks for the channel to become valid:
$ btcctl --simnet --rpcuser=kek --rpcpass=kek generate 6
Now you could follow the execution into the funding/manager.go : ProcessFundingMsg but this sends a signal to a go-routine, and Visual Studio Code won’t help. That’s an issue with goroutine and channels: debuggers are not able to follow the execution flow. But with a bit of investigation we can see the signal triggers handleFundingOpen just below it.
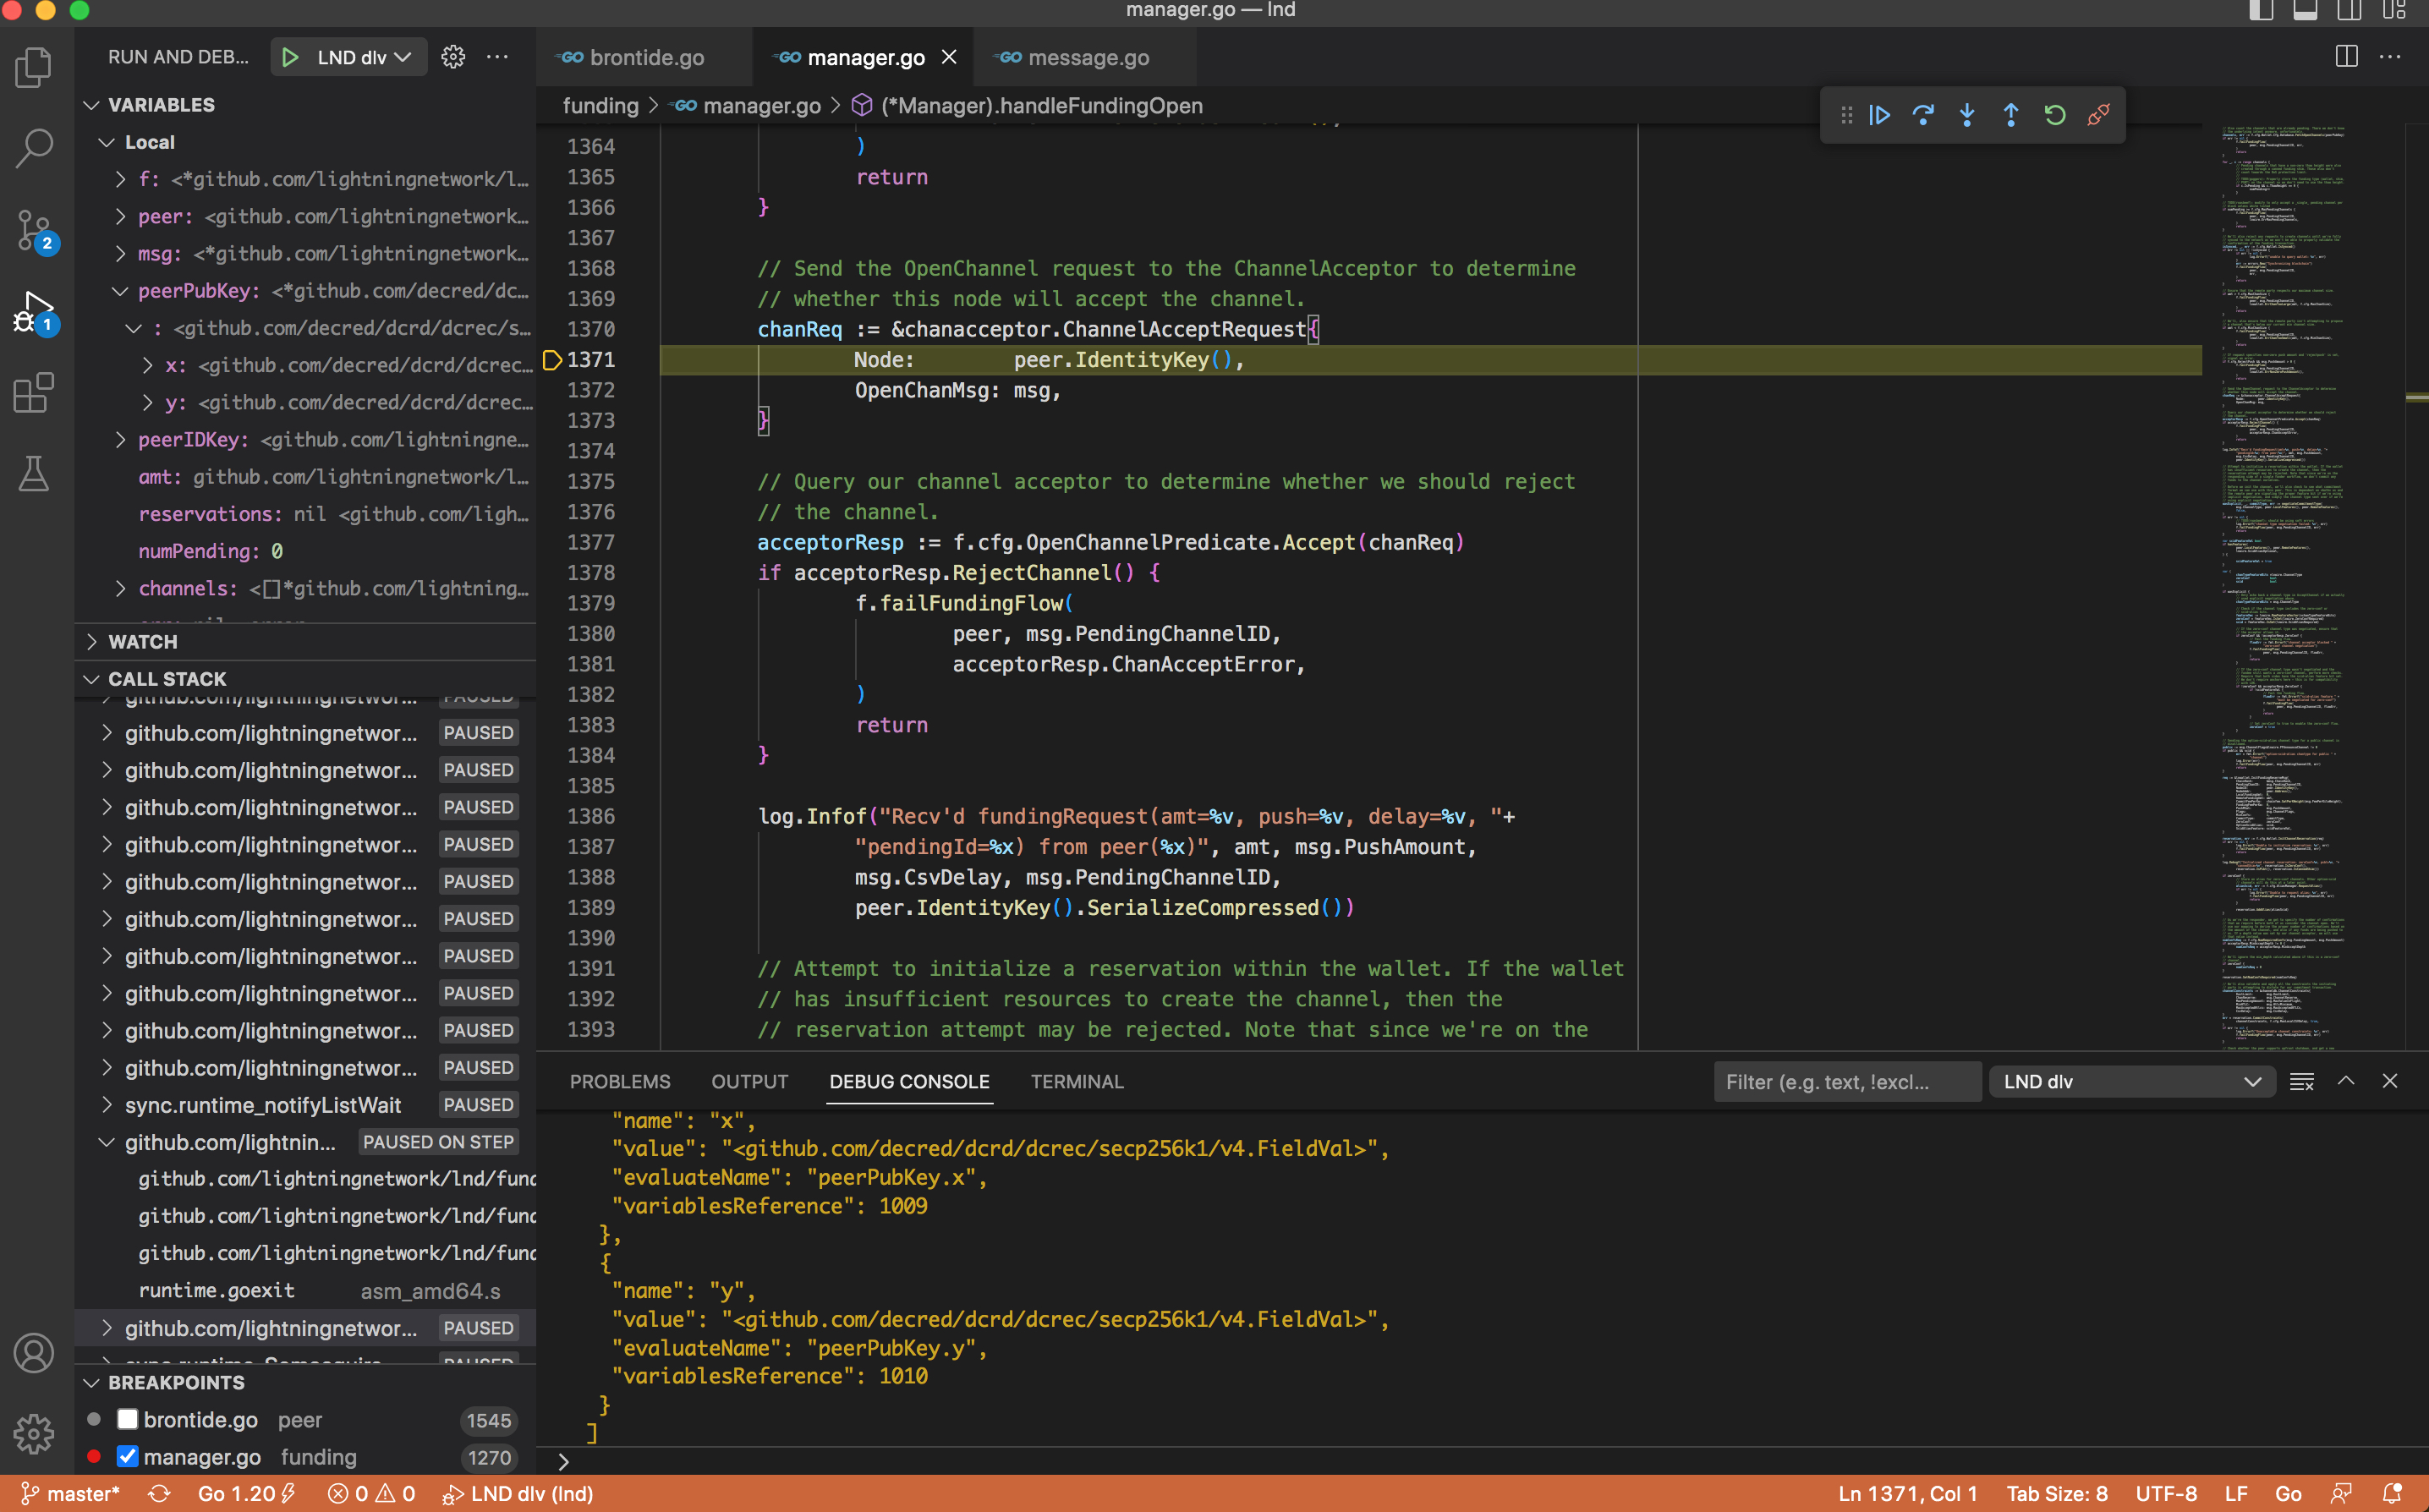
So set a breakpoint in funding/manager.go : handleFundingOpen and step through the intricate channel funding logic and mechanism.
Congrats!
Congrats if you’ve made it alive this far, and keep on going, this is only the start of the journey. You’re well on your way to becoming an official LND contributor!